Today’s question is from Debbie and she asks
“Can you please explain and simplify the cholesterol numbers and charts?”
This is a good question because I think we should all know more about how our body works because nobody will care more about your health than you will.
Total Cholesterol
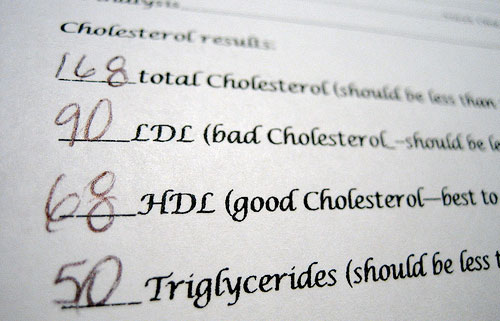
First, we have your “Total Cholesterol” numbers, which is the sum of all the cholesterol in your blood.
As you can see from the chart, your goal should be less than 200mg/dL
| Total Cholesterol Level | Category |
|---|---|
| Less than 200 mg/dL | Desirable |
| 200 — 239 mg/dL | Borderline high |
| 240 mg/dL and above | High |
However, I’d like to point out that I personally believe that anything less than 150mg/dL is TOO LOW!
And yes, your cholesterol can be “too low” and I think that’s just as bad as “too high”, which is over 240mg/dL.

What most people don’t know or understand, is that your body NEEDS cholesterol and it has many important functions, such as:
- Producing your “sex hormones”, such as testosterone, estrogen, progesterone, DHEA, and similar “youth” hormones
- Utilizing Vitamin D and other fat-soluble vitamins, which helps your bones, nerves, metabolism, skin elasticity, strong immunity, and so forth.
- Proper brain function, memory, cognition, balancing dopamine, serotonin, and other “feel good” neurotransmitters.
And this is a major problem with cholesterol-lowering drugs and why they cause:
- Impotence
- Memory loss
- Accelerated aging
- Depression
- Etc.
In a minute I’ll show you how you can easily support healthy cholesterol levels naturally, WITHOUT the use of these harmful drugs or a restrictive diet.
However, what I’d like to point out is that what matters most is the CORRECT BALANCE in your lipid levels, which is what I want to talk about next and that’s your HDL/LDL ratios…

HDL (Good) Cholesterol Level Chart
First I’d like to start with your HDL, which is short for “high-density lipoprotein”.
Your HDL is considered the “good” cholesterol because it can help decrease the cholesterol buildup in the walls of your arteries, which causes narrowing of their openings.
| HDL (Good) Cholesterol Level | HDL Cholesterol Category |
|---|---|
| Less than 40 mg/dL | A major risk factor for heart disease |
| 40 — 59 mg/dL | The higher, the better |
| 60 mg/dL and above | Considered protective against heart disease |
Generally speaking, the higher your HDL, the better.
For example, after giving my mom some specific herbs that I’ll tell you about in a minute, I was able to raise her “good” HDL from 52 mg/dL to 94 mg/dL
Her cardiologist and I are very happy because sometimes my mom’s TOTAL cholesterol goes in the “borderline high” range (200-239 mg/dL).
However, we’re okay with that because her “good” HDL is so high and thus, very protective.
LDL (Bad) Cholesterol Level Chart
Lastly, I’d like to finish with your LDL, which is short for “low-density lipoprotein”.
| LDL (Bad) Cholesterol Level | LDL Cholesterol Category |
|---|---|
| Less than 100 mg/dL | Optimal |
| 100 — 129 mg/dL | Near optimal/above optimal |
| 130 — 159 mg/dL and above | Borderline high |
| 160 — 189 mg/dL | High |
| 190 mg/dL and above | Very High |
Your LDL is considered the “bad” cholesterol because the risk of heart disease goes up if you have high levels of LDL. So you want this to be LOW
This is basically the OPPOSITE of what HDL does.
Summary
Remember, your goal is to have healthy cholesterol levels in the range of 150-200 mg/dL.
Too LOW is just as bad as too HIGH.
And what matters most with your cholesterol numbers is your HDL/LDL ratios.
You want your “good” HDL to be high and “bad” LDL to be low.
A good way to remember this is the “H” in HDL for HIGH and “L” in LDL for LOW.
I think we can all agree that healthy cholesterol levels is very important for your health, fitness & longevity (heart & brain health, sexual performance, arteries, etc.).
Unfortunately, most of us don't have the time, money or devotion to make big lifestyle changes (diet, exercise, stress management, etc.) Plus, AGING is another major factor (not just lifestyle)...
Well, the good news is that now you can quickly achieve your "healthy cholesterol" goals with ONE simple solution that's easy, convenient & requires NO lifestyle changes...